
Viewing hardware and software interaction is much easier with a logic analyzer style trace. In almost every job I’ve had I’ve added a VCD tracer to the instruction set simulator. Both the “big picture” state flow can be seen, and the “little details” of bus/register/interrupt/io interaction can be seen.
For that purpose I’ve forked the RISC-V ISA Simulator, https://github.com/five-embeddev/riscv-isa-sim/tree/vcd_trace.
About the fork
This fork adds a few features.
- Tracing of registers and memory bus.
- Time limit for simulation.
- New commands to trace variables.
- Two way symbol <-> address lookup.
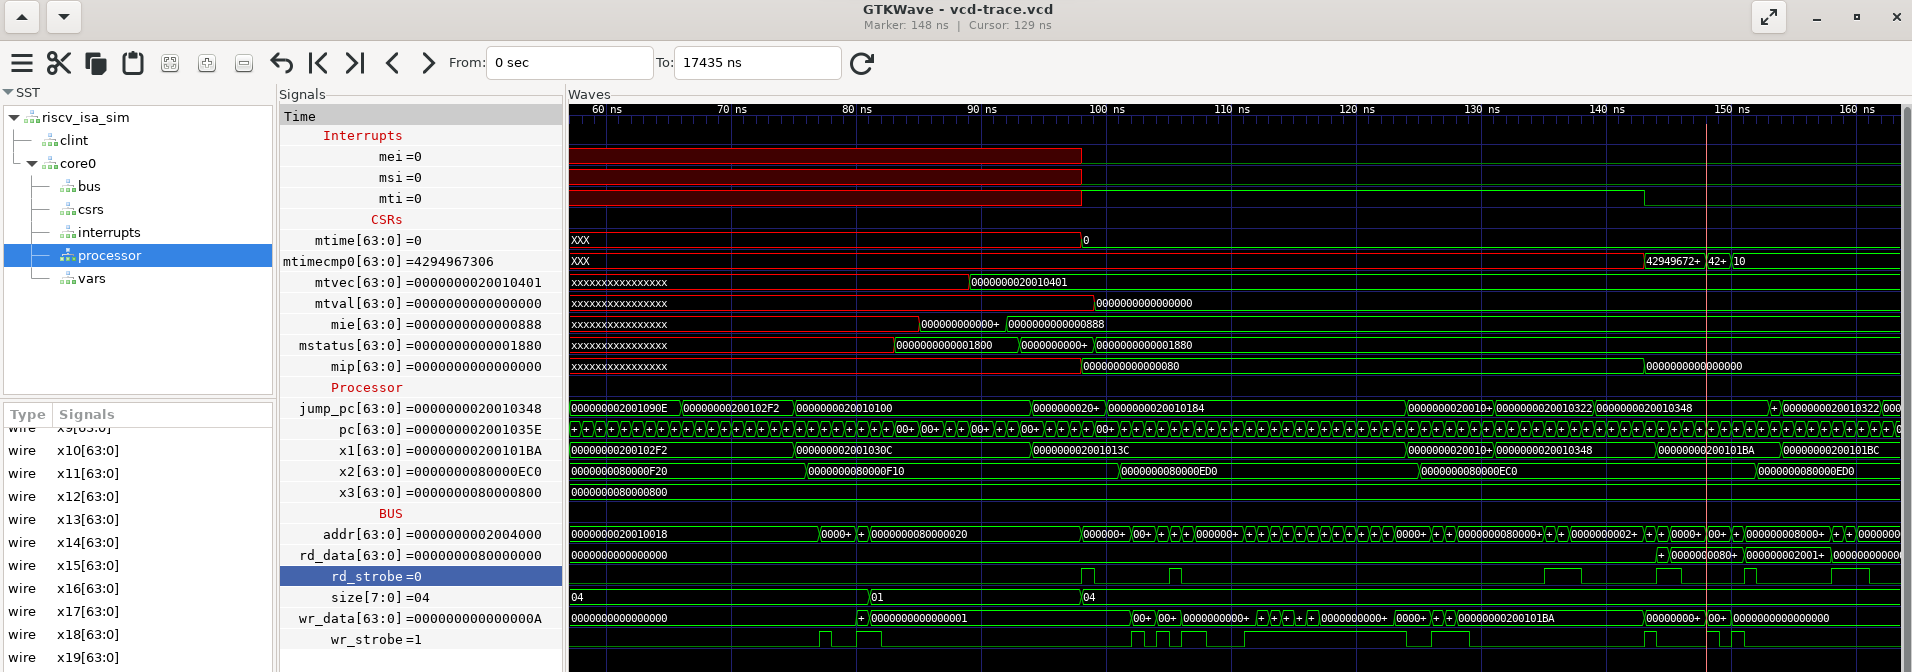
This is an example of a firmware writing to the mtimecmp register:
Extending the Spike RISC-V ISA Simulator
The simulator seems to be designed for evaluating the RISC-V ISA, not for achieving performance. It’s also designed to mostly match a hardware system - with a clear encapsulation for bus interfaces, interrupt controllers, registers and each instruction implementations.
This makes it easy to extend.
Where it deviates from hardware is the “interleave” feature. Instructions are processed in batches of 5000 instructions per hart. During this interleave the CPU state is not synced as strongly. For example the timer will only update once every 5000 instructions.
Changed Files
fesvr/{htif.h,htif.cc,elfloader.h,elfloader.cc}- Updated to allow two way symbol <-> address mapping and to record variable size.riscv/clint.{h,cc}- Added tracing formtimeandmtimecmp.riscv/csr.{h,cc]- Added tracing for each CSR register. Implemented the debug injection and special tracing formti,meiandmsi.riscv/decode.h- Made the decode functionsconstcorrect. Added a trace for each ISA register. Use read/write functions to trace the PC. Added a flag to indicate when PC updates are jumps (not branches). Added tracing for WFI state.riscv/devices.h- Added the trace variables formti,meiandmsihere.riscv/execute.cc- Added the tracing of opcodes here. Changed the PC to have read/write methods.riscv/insr/*- Updated the instructions that update the PC to improve tracing.riscv/interactive.cc- Added new commands here.riscv/mmu.h- Added memory bus tracing.riscv/processor.cc- Elaborate the trace signal hierarchy.riscv/processor.h- Define the variable tracing classes. PC, WFI, opcode trace variables.riscv/sim.cc- Instantiate and elaborate the VCD trace. Update the VCD timestamp and sync to disk.riscv/trace_bus.cc- Implement the bus signal tracing and variable tracing classes.vcd_trace/*- Integrate with the VCD trace library https://github.com/nakane1chome/cpp-vcd-tracer.
New Options
  --vcd-log=<file>      Log VCD to this file.
  --max-cycles=<cycle count>      Limit simulation to this number of cycles.
New Interpreter Commands
echo <on|off>
interrupt <core>  <raise|clear> <mei|mti|msi>
trace <name> <addr> <size>
trace <var>
echo <on|off>
Interpreter commands will be echo’ed to the console.
This allows log output to be examined with the commands included as part of the log.
interrupt <core> <action> <interrupt>
<core>: Select the HART to apply the interrupt to.<raise|clear>: Raise or clear the interrupt at the source.<mei|mti|msi>: Select the type of interrupt.
trace <name> <addr> <size>
Trace a variable. Provide the name, address and size to trace. The size will determine the number of bytes to trace and the type of integer conversion.
Any bus access to the given address will be reported to the console.
The variable will be traced to the VCD log file if the trace command is issued before the simulation is started.
trace <var>
Trace a variable. The symbol will be looked up and traced according to the above command.
VCD Logging
Trace the processor internals with VCD. This can be viewed with GTKWave and many commercial tools.
The following are traced:
- PC
- Opcode
- Core registers
- CSR registers
- Memory bus read/write access
- Machine mode interrupts (msi, mti, mei)